Are you living in the middle of one of the nation’s top 32 flu hot spots this week? A new app and website wants to let you know.
The flu remains close to its highest levels nationally, according to a data collected by a new mobile app and website that gives people instant access to information on 15 different illnesses (including Lyme and Croup), collected from nearly one million doctors’ offices across the nation.
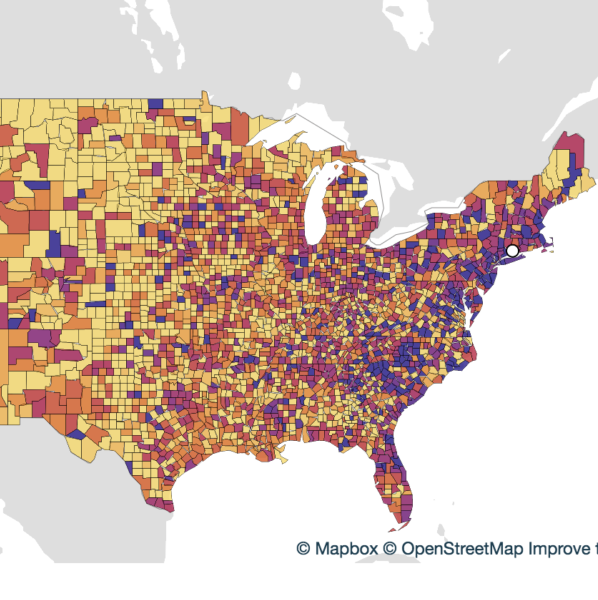
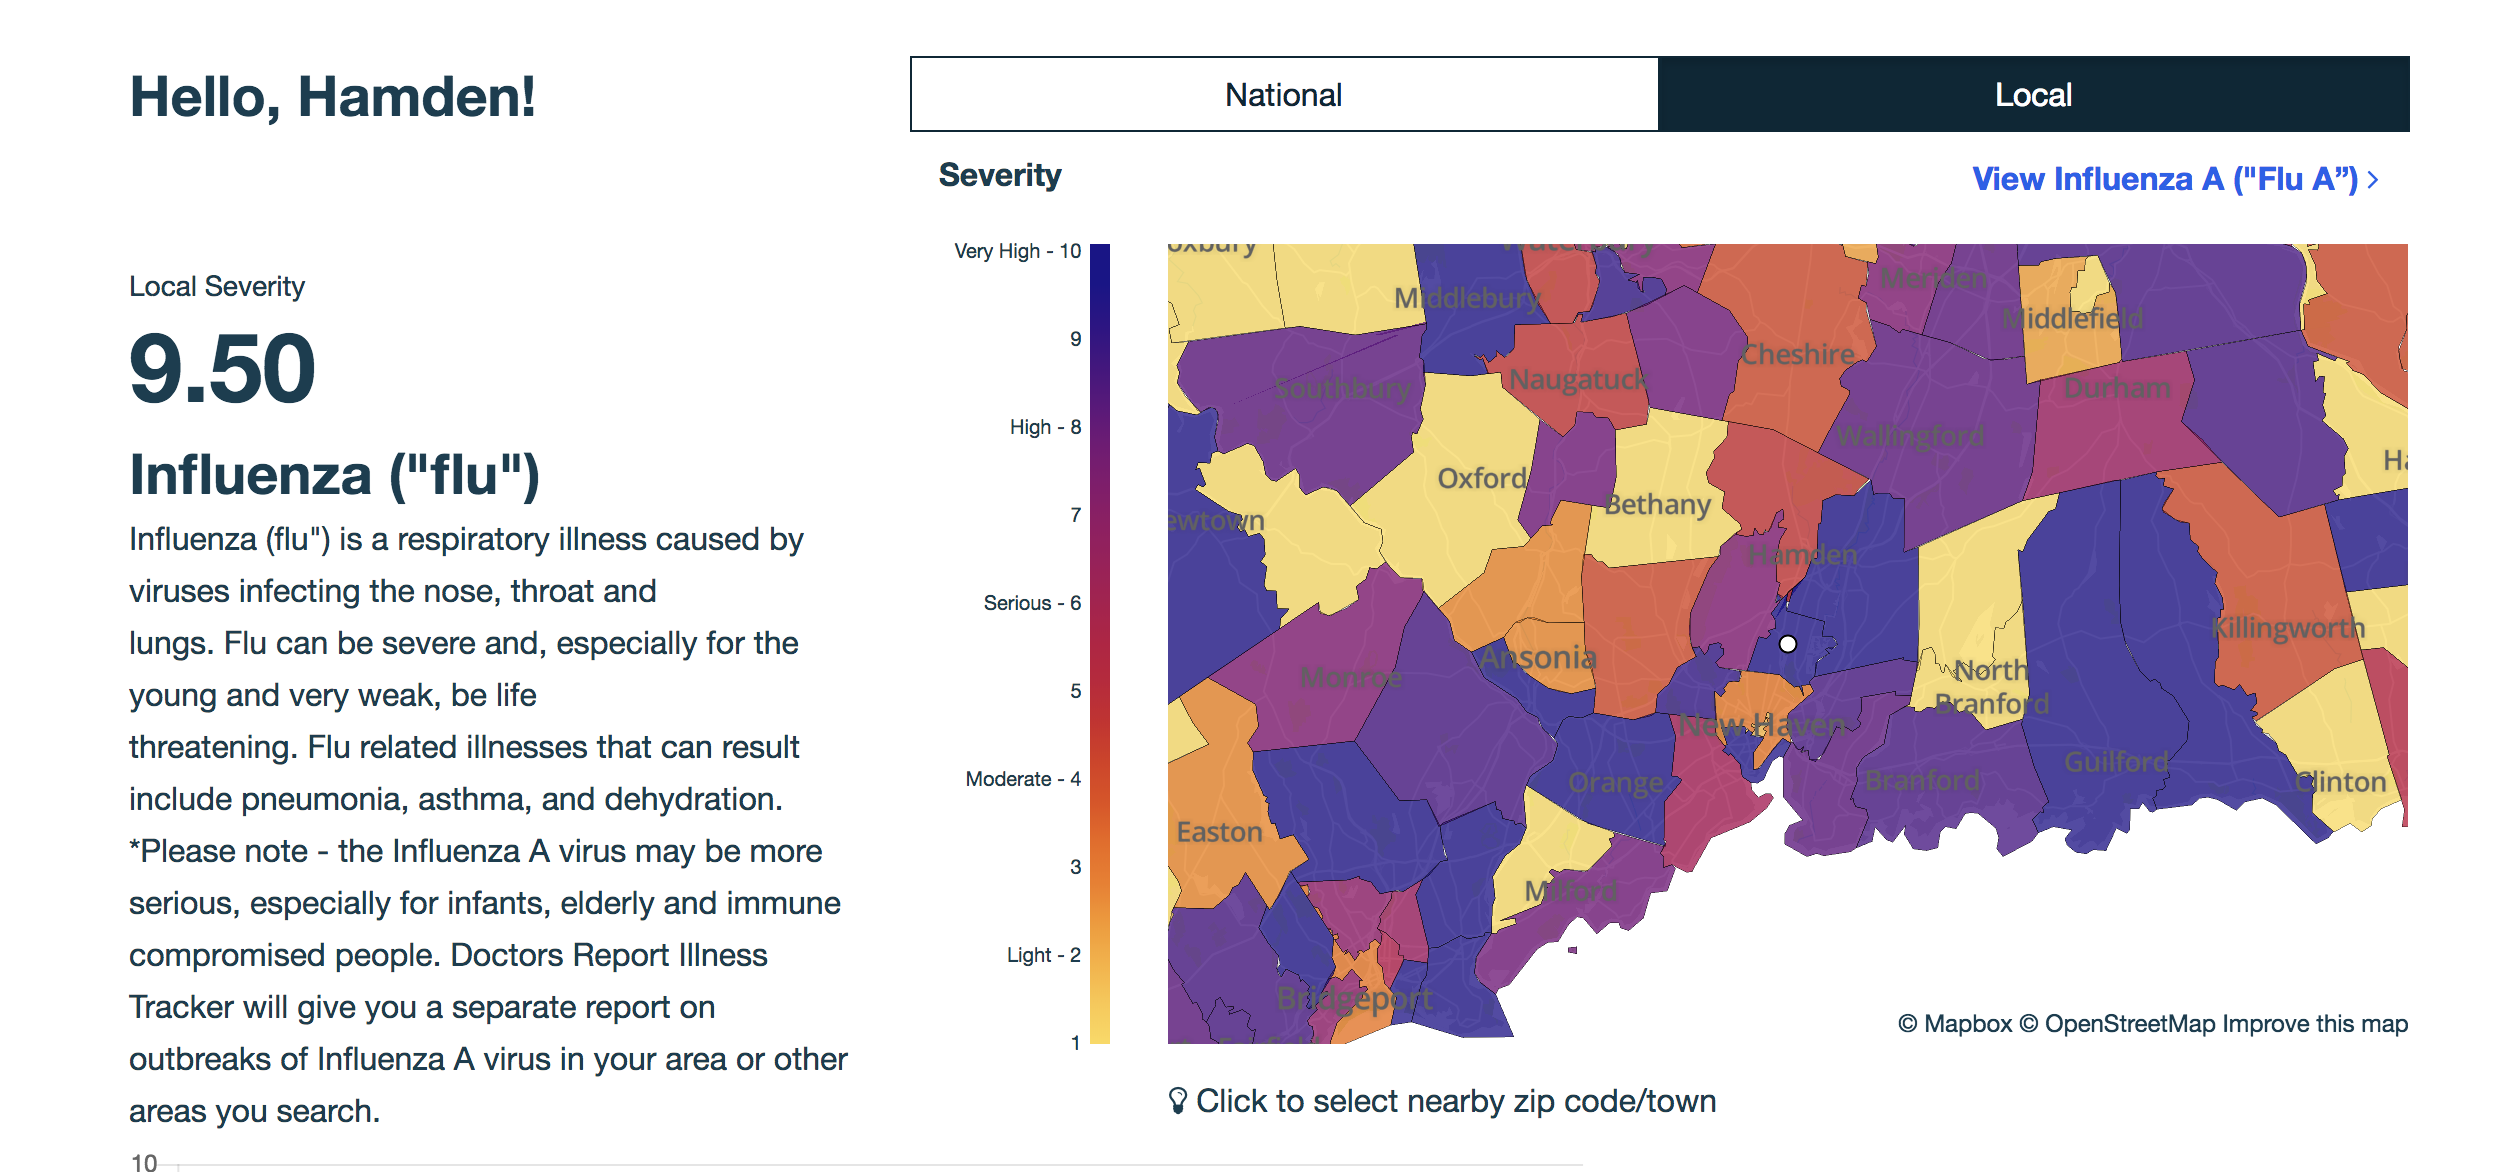
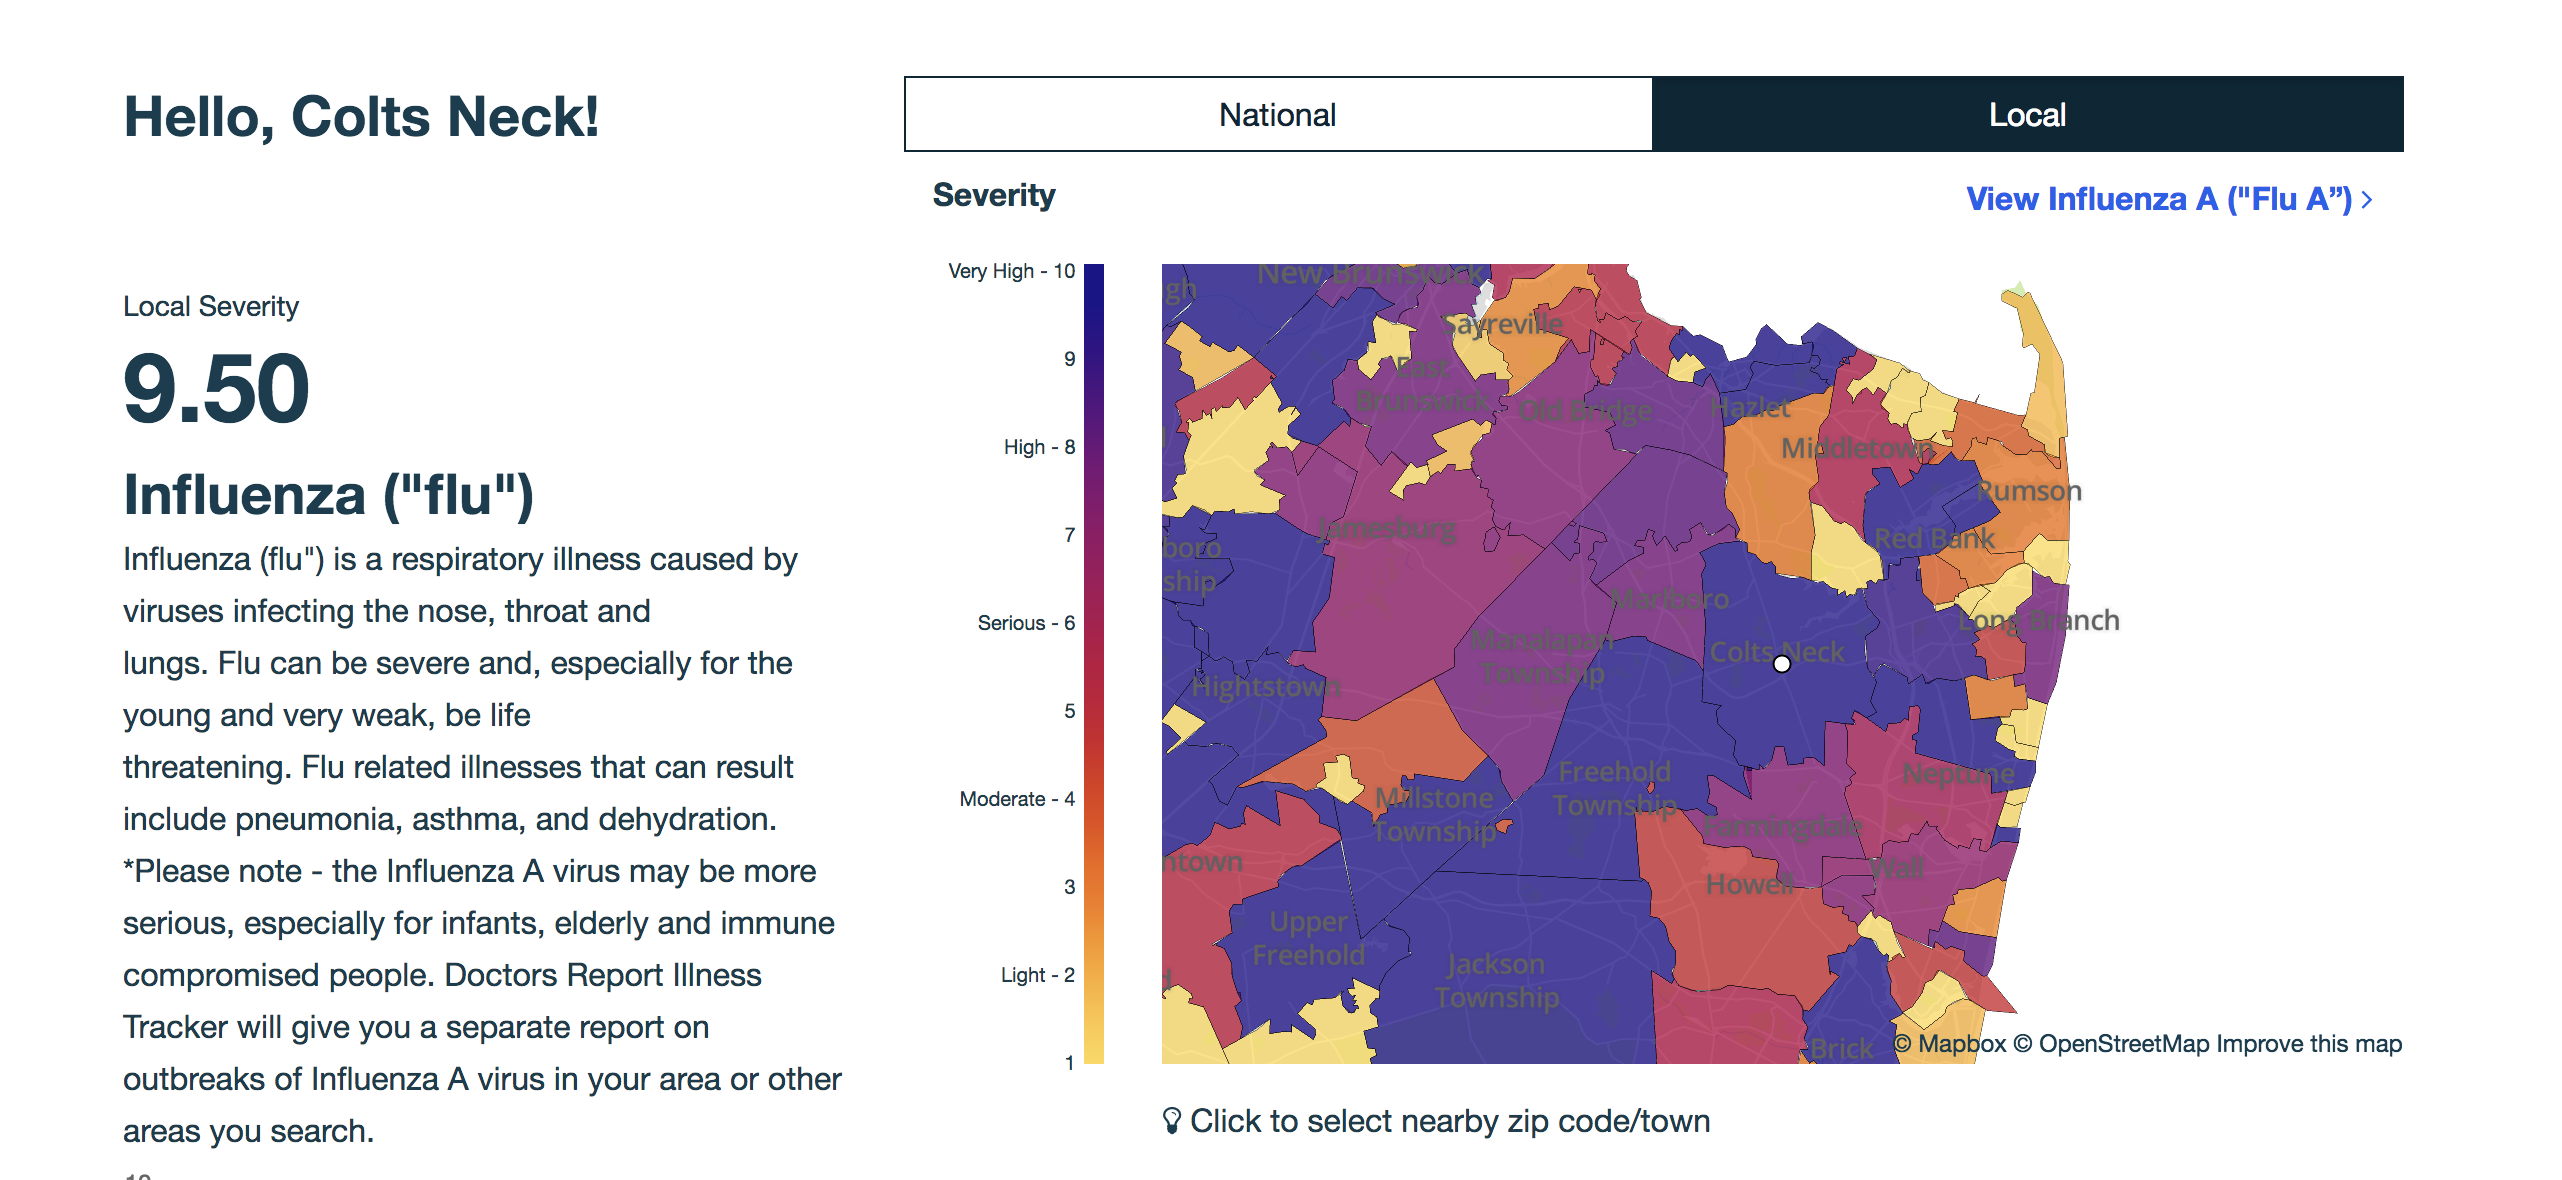
If you want to see how your area fairs, click on the DoctorsReport.com, go to Illnesses, click on the sickness you want to track, and enter your zip code. You can start with a “national” view, and then click on your town too.
Or, check out the latest list below to see if your area’s on it! Here are a few places I just looked into:
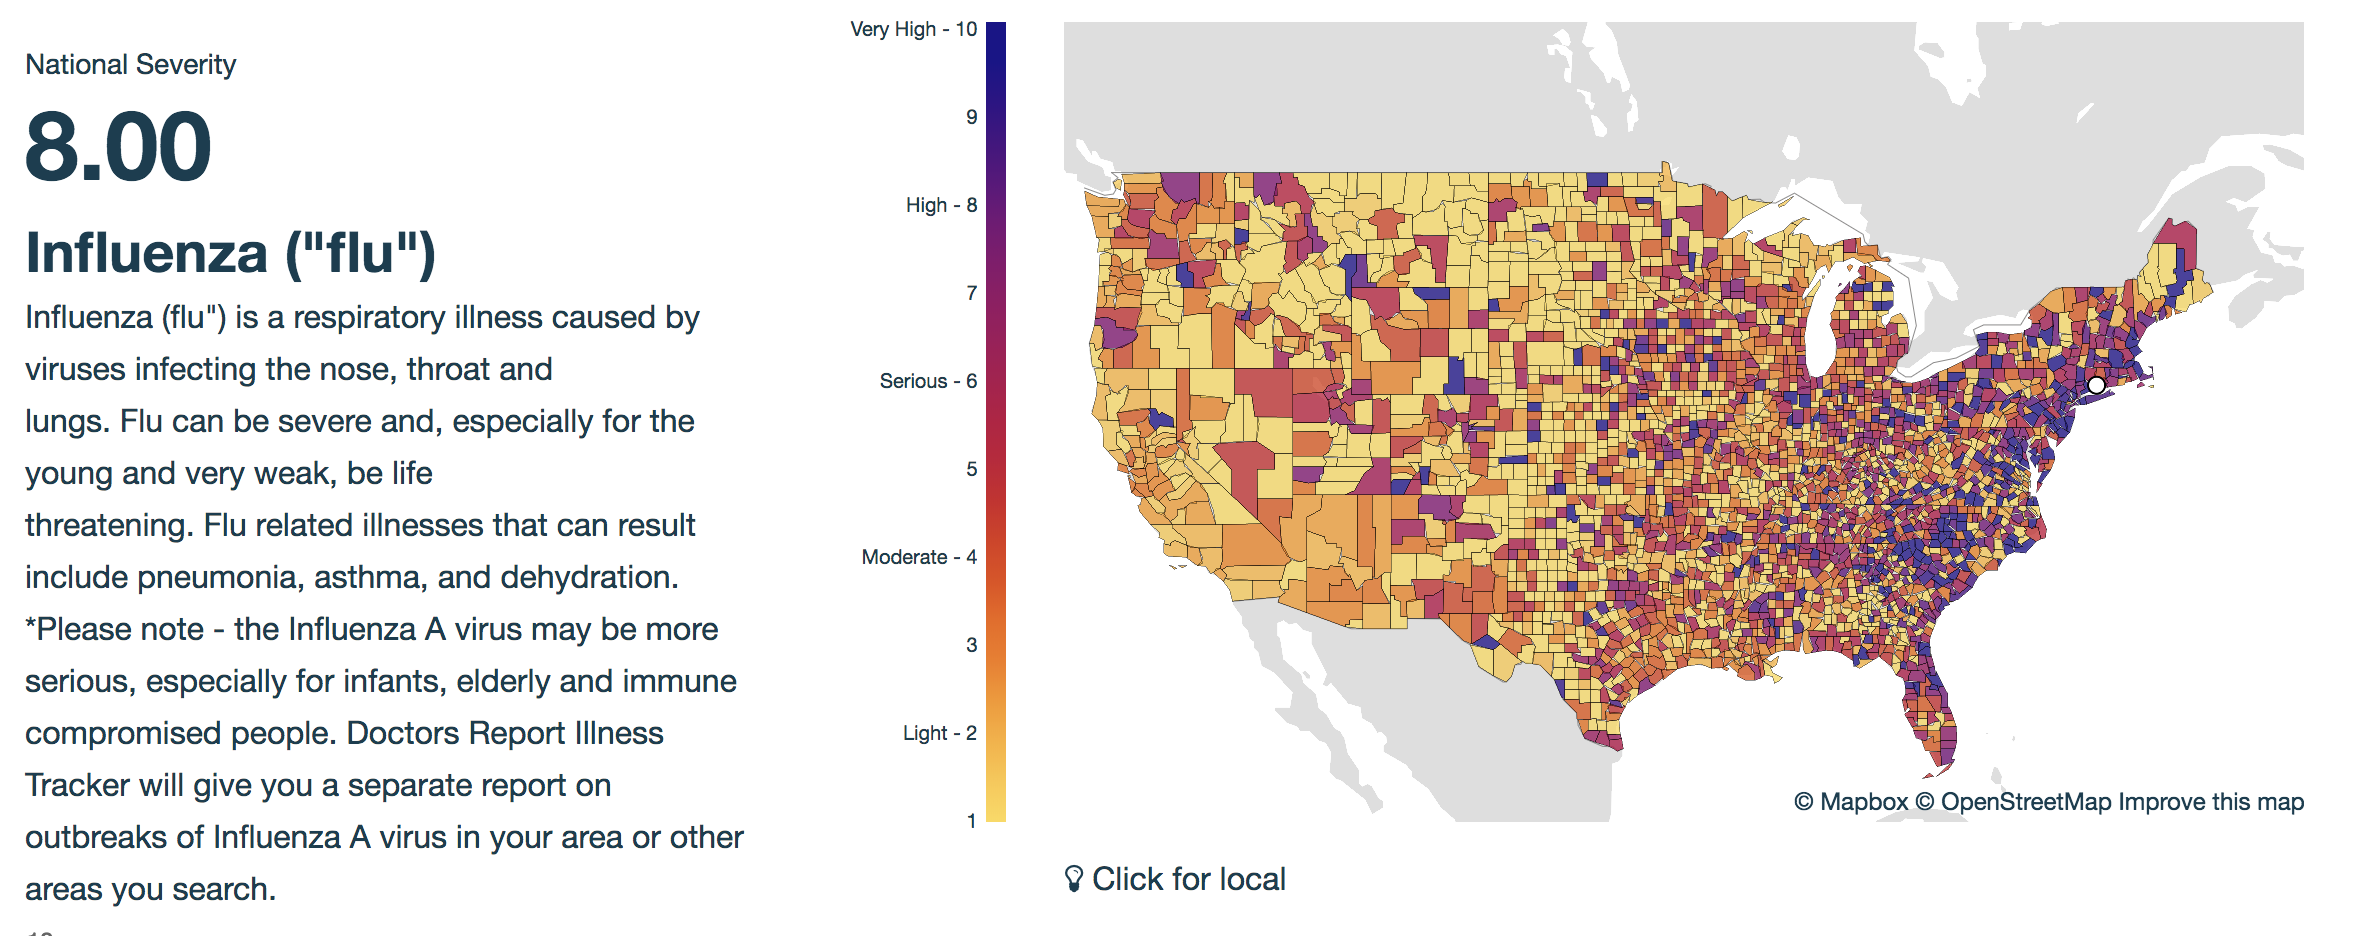
The DoctorsReport.com updated its current list of the nation’s top Influenza hot spots (by metro area) in the nation. Eleven areas are on basic “red alert” for “very high” designations; 11 metros received “high” designations; and 10 metros received “serious” designations. The company also says the severity level of the flu nationally is 9.0 on a scale of 1 to 10 (10 being most severe) after three consecutive weeks at 9.5.
Doctors Report Illness Tracker FLU REPORT as of 2.22.18:
Specific metros are listed according to the Doctors Report illness severity scale, with 10 being most severe and 0 being least severe:
Very High
- New York-Newark-Jersey City, NY-NJ-PA at 9.5
- Washington-Arlington-Alexandria, DC-VA-MD-WV at 9.5
- Boston-Cambridge-Newton, MA-NH at 9.5
- Miami-Fort Lauderdale-West Palm Beach, FL at 9.5
- Atlanta-Sandy Springs-Roswell, GA at 9.5
- Charlotte-Concord-Gastonia, NC-SC at 9.5
- Orlando-Kissimmee-Sanford, FL at 9.5
- Jacksonville, FL at 9.5
- Richmond, VA at 9.5
- Baltimore-Columbia-Towson, MD at 9.0
- Pittsburgh, PA at 8.5
High
- Buffalo-Cheektowaga-Niagara Falls, NY at 8.0
- Grand Rapids-Wyoming, MI at 8.0
- Indianapolis-Carmel-Anderson, IN at 7.5
- Raleigh, NC at 7.5
- Detroit-Warren-Dearborn, MI at 7.0
- Columbus, OH at 7.0
- Cleveland-Elyria, OH at 7.0
- Chicago-Naperville-Elgin, IL-IN-WI at 6.5
- Dallas-Fort Worth-Arlington, TX at 6.5
- Tampa-St. Petersburg-Clearwater, FL at 6.5
- Nashville-Davidson–Murfreesboro–Franklin, TN at 6.5
Serious
- Kansas City, MO-KS at 6.0
- Cincinnati, OH-KY-IN at 6.0
- Austin-Round Rock, TX at 5.5
- Louisville/Jefferson County, KY-IN at 5.5
- Minneapolis-St. Paul-Bloomington, MN-WI at 5.5
- Hartford-West Hartford-East Hartford, CT at 5.0
- New Orleans-Metairie, LA at 5.0
- Birmingham-Hoover, AL at 5.0
- Seattle-Tacoma-Bellevue, WA at 4.5
- Oklahoma City, OK at 4.5
The current severity rankings for Influenza A, a different category of influenza, which can be severe are:
Very Serious
- Providence-Warwick, RI-MA at 9.5
- Raleigh, NC at 9.5
- Hartford-West Hartford-East Hartford, CT at 9.5
- Baltimore-Columbia-Towson, MD at 9.0
- New York-Newark-Jersey City, NY-NJ-PA at 8.5
- Atlanta-Sandy Springs-Roswell, GA at 8.5
High
- Boston-Cambridge-Newton, MA-NH at 8.0
- Orlando-Kissimmee-Sanford, FL at 7.5
- Richmond, VA at 7.5
Serious
- Chicago-Naperville-Elgin, IL-IN-WI at 6.0
- Washington-Arlington-Alexandria, DC-VA-MD-WV at 6.0
- Miami-Fort Lauderdale-West Palm Beach, FL at 6.0
- Charlotte-Concord-Gastonia, NC-SC at 5.5
- Tampa-St. Petersburg-Clearwater, FL at 5.0
- Birmingham-Hoover, AL at 5.0
- Detroit-Warren-Dearborn, MI at 4.5
- Indianapolis-Carmel-Anderson, IN at 4.5
- Buffalo-Cheektowaga-Niagara Falls, NY at 4.5
Influenza (“flu”) is a respiratory illness caused by viruses infecting the nose, throat and lungs. The flu can be severe and, especially for the young and very weak, be life threatening. Flu-related illnesses that can result include pneumonia, asthma and dehydration.
About the Doctors Report Severity Scale
DoctorsReport.com tells me it uses a proprietary set of algorithms for gauging the severity of 15 common illnesses including Influenza, Lyme disease, Bronchitis, and Croup. The major factors that define the severity scale are: number of diagnosed and reported cases from actual doctors’ offices using the technology and comparisons to historical trends for the same area.
The geographic accuracy of the data can be narrowed to zip code and broken down by health condition and age group. For more information on the website and app, and to download it, visit www.doctorsreport.com.